

 By Pete Pennicott | September 11, 2026
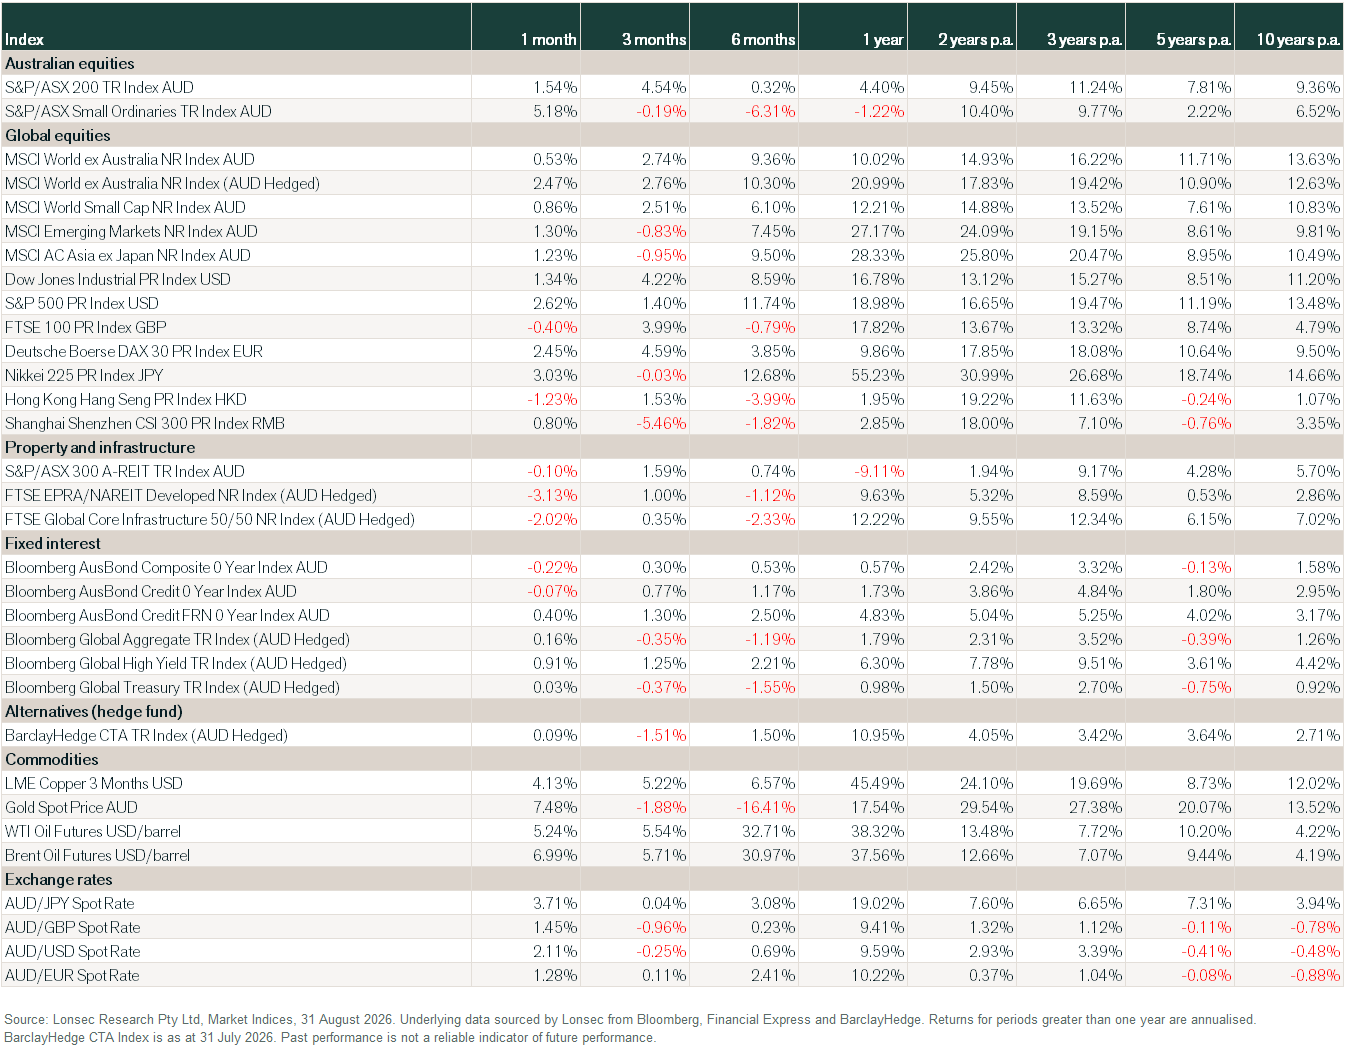
August looked unremarkable in the index column and was anything but underneath. Global shares recovered from July’s technology sell-off, commodities rallied hard, gold had one of its better months in years, and a single speech in Wyoming repriced the interest rate outlook in the final week.
Australian equities
The ASX 200 Accumulation Index returned 1.54% in August, its fifth consecutive positive month, after touching a record level in the first week.
Underneath this was wide dispersion. The ASX 20 (twenty largest companies), which dominate most Australian share portfolios was down −0.63%. Meanwhile, the MidCap 50 returned 5.81% and the Small Ordinaries 5.18%. It was one of the widest large-versus-small gaps in recent memory, and it was driven almost entirely by where the earnings surprises landed.
August’s reporting season delivered aggregate FY26 earnings growth for the ASX 200 around 11%, comfortably ahead of both pre-season expectations and the low single-digit growth of the prior three years.
The composition matters far more than the headline, and sector dispersion was extraordinary, as shown by the wide range of price moves across the month.
Bank results provided clear evidence that Federal Budget changes, inflation, and interest rate pressures are reaching households. Mortgage applications across the major banks fell an estimated 12–15% following the May Budget, and competition for the loans that remain is intense. With Financials at roughly a quarter of the index, a 5.31% fall there is what kept the headline return so modest.
Consumer-facing results told a consistent story: households are still spending, but they are being particular. Supermarkets held up well, supported by value-conscious behaviour, while discretionary retailers felt the squeeze of tighter budgets.
Global equities
Global markets broadly advanced in local currency terms, with leadership rotating across technology, materials and energy. Technology momentum resumed after July’s worries about AI capital expenditure, and the leadership broadened. Interestingly, software outperformed semiconductors for a second consecutive month, reversing the earlier narrative that software business models would simply be displaced by AI.
The earnings backdrop justified the recovery. By late August, around 94% of S&P 500 companies had reported, with roughly 87% exceeding expectations. Looking forward, consensus third-quarter earnings growth is tracking above 28% year on year.
Results across the major indices, in local currency terms, were mixed: the S&P 500 rose 2.62%, the Nikkei 225 3.03%, the DAX 2.45% and the Dow 1.34%. The CSI 300 added 0.80%. The FTSE 100 fell 0.40% and the Hang Seng 1.23%.
For Australian investors, the currency is the big story. The MSCI World ex Australia index returned 2.47% hedged into Australian dollars but only 0.53% unhedged. This mirrors March, when a falling dollar cushioned heavy offshore losses.
Property and infrastructure
It was a weak month for listed real asset sectors. Australian A-REITs were essentially flat, with the ASX 200 A-REIT index returning −0.10%. Global listed property fared considerably worse, with the FTSE EPRA/NAREIT Developed index returning −3.13% hedged into Australian dollars. Global listed infrastructure also fell, with the S&P Global Infrastructure index down 2.65% and the FTSE Global Core Infrastructure 50/50 down 2.02%, both hedged.
Rising long bond yields are the common thread. Both sectors carry long-duration, yield-sensitive earnings, and a month in which Australian 10-year yields rose 17 basis points and the US 30-year briefly touched its highest level since 2007 was never going to be kind to them.
Fixed interest
Bond markets spent August pulled between two opposing forces: fiscal concerns pushing long yields up, and an unusual policy intervention pushing them back down.
In a surprise move, the US Treasury announced a significant expansion of its long-dated bond buyback program. It came after the 30-year yield climbed to nearly 5.34% (highest since 2007) due to the combined forces of US public debt, heavy government issuance, fast growing debt issuance from the hyperscalers, and renewed inflation fears out of the Middle East.
It provided some instant relief, but it was short-lived. Warsh’s Jackson Hole address lifted the front end sharply as markets repriced the likelihood of rate hikes. Over the month, the US curve flattened with the 10-year at 4.75%, up just 2 basis points.
Australian bonds sold off harder. The 3-year yield rose 17 basis points to 4.66% and the 10-year rose 17 basis points to 5.09%, as markets built in the prospect of further RBA tightening. The Bloomberg AusBond Composite returned −0.22% for the month, with government bonds weaker again at −0.26% and inflation-linked bonds worst at −0.50%. Floating rate credit returned 0.40% and cash (measured by the Bank Bill index) returned 0.38%.
Global fixed interest held up a little better. The Bloomberg Global Aggregate returned 0.16% hedged into Australian dollars and the Global Treasury index 0.03%. Credit did the work, with global high yield returning 0.91% as US high yield spreads narrowed 18 basis points to 2.73%, and emerging market debt 0.86%. Investment grade spreads were unchanged at 0.80%.
Currencies and commodities
The Australian dollar rose 2.11% against the US dollar and was stronger against every major currency: up 3.71% against the yen, 1.45% against sterling, 1.30% against the New Zealand dollar and 1.28% against the euro.
Commodities were strong gainers in August. The CORECommodity CRB Index rose 6.61% and the S&P Goldman Sachs Commodity Index 4.45%. Copper added 4.13% and aluminium 1.95%. Oil rallied, with Brent futures up 6.99% and WTI up 5.24%.
Gold rose 7.48% in Australian dollar terms and closer to 10% before the currency effect. This appears to reflect a revived debasement narrative following the Treasury’s intervention and a softer US dollar.
Australia
The RBA left the cash rate unchanged at 4.35% in a unanimous decision. The accompanying Statement on Monetary Policy made clear the Board’s bias has shifted: risks to inflation are now framed as tilted to the upside. Governor Bullock said a further increase was “quite possible” and singled out weak productivity growth as a persistent constraint on how fast the economy can grow without generating inflation.
The July CPI landed in late August and changed things. Prices rose 1.0% for the month, taking the annual headline rate to 3.5% against a 3.3% forecast, while the trimmed mean held at 3.6%. Housing remained the largest single driver at more than 5% over the year.
By the end of August, markets had priced in around 42 basis points of further RBA tightening.
Residential property is now in a clear downturn. Cotality data showed national dwelling values fell 0.9% in August, with capital cities down 1.1%, a fifth consecutive monthly decline that leaves values around 3.6% below their March 2026 peak. Falling affordability, interest rate hikes, reduced investor demand following the changes to negative gearing/capital gains tax, and weak confidence are all contributing. Building approvals turned negative again.
Consumer confidence rose in August, concentrated among mortgage holders relieved by the rate hold, but the Westpac index at 88.9 remains extremely low by historical standards and NAB business confidence stayed negative at −8.
United States
US data continued to send mixed signals. Annual headline inflation eased to 3.4% in July, while core CPI slowed to 2.5%. However, the Fed’s preferred inflation measure, the PCE price index, remained elevated at 3.7%, with core PCE at 3.3%. Inflation had moderated on some measures, but a sustained return to target remained uncertain.
Against that, business activity held up. The ISM Manufacturing PMI eased to 54.6 in August from July’s near four-year high of 55.6, still an eighth consecutive month of expansion.
The defining event was Warsh’s first Jackson Hole keynote as Chair. He noted that inflation has now run above target for 65 consecutive months, and that current financial conditions are not sufficiently restrictive. He recommitted to the 2% core PCE target and signalled the Fed is prepared to resume hiking if disinflation does not accelerate convincingly.
Rest of world
Eurozone headline inflation rose to an estimated 3.3% in August from 2.9% in July, driven largely by higher energy inflation. Core inflation eased to 2.4%, highlighting the different pressures across the economy. The initial estimate showed GDP grew 0.4% in the June quarter. The ECB held interest rates steady in July, while emphasising that future decisions would depend on incoming data and the inflation outlook.
Japan’s annual headline inflation reached 1.9% in July. At its latest meeting on 31 July, the Bank of Japan held its policy rate at 1.0%, with one member favouring an increase. The decision highlighted differing views about how quickly monetary policy should tighten.
China’s figures also presented a mixed picture. Annual consumer inflation was subdued at 0.5% in July. Producer prices fell during the month but remained 3.5% higher than a year earlier. The official manufacturing PMI improved to 49.8 in August, although it remained below the expansion threshold of 50. Exports provided support, with research pointing to strong demand for technology products linked to the global AI investment cycle.
Pete is the Co-Founder, Principal Adviser and oversees the investment committee for Pekada. He has over 18 years of experience as a financial planner. Based in Melbourne, Pete is on a mission to help everyday Australians achieve financial independence and the lifestyle they dream of. Pete has been featured in Australian Financial Review, Money Magazine, Super Guide, Domain, American Express and Nest Egg. His qualifications include a Masters of Commerce (Financial Planning), SMSF Association SMSF Specialist Advisor™ (SSA) and Certified Investment Management Analyst® (CIMA®).